
Auditing Vertical Profile Slopes and Safety K-Values
Learn standard procedures for extracting Civil 3D alignment exports, validating vertical curve K-values, calculating superelevation runoff transitions, and processing DTM survey datasets.
ℹ️ Instructional Notice:
All station chainages and coordinate references demonstrated in these workflows use synthetic example data created solely for technical instruction and software verification.
Tutorial Courses (4)
Auditing Vertical Profile Slopes and Safety K-Values
A step-by-step engineering tutorial explaining how to audit crest and sag vertical parabolic curves, compute algebraic grade differences, and verify K-values against Stopping Sight Distance safety envelopes.
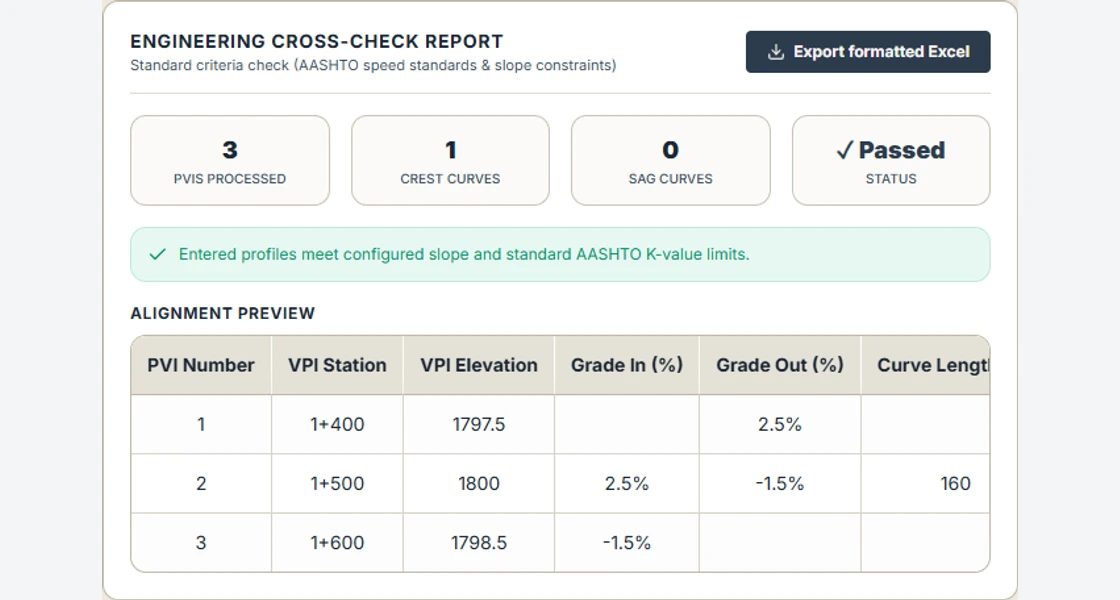
Step 1: Export Profile PVI Station Listings in Civil 3D
In Autodesk Civil 3D, navigate to the Toolspace > Toolbox tab. Expand Reports Manager and then Profile. Double-click the Profile PVI Report or Profile Curve Report.
Select your finished design profile (e.g., FRL_Mainline) and uncheck the existing ground surface profile. Export the file as a CSV or Excel table.
The output spreadsheet contains critical profile parameters: PVI Station, PVI Elevation, Grade In (g1 %), Grade Out (g2 %), and Vertical Curve Length (L_v).
Step 2: Calculate Algebraic Grade Differences (A) & Parabolic Rates
For every Point of Vertical Intersection (PVI), compute the absolute algebraic difference in grades A:
Where g1 and g2 are expressed as percentages (e.g., +4.0% and -2.5% yields A = |4.0 - (-2.5)| = 6.5%).
• If g1 > g2, the curve is a Crest Curve.
• If g1 < g2, the curve is a Sag Curve.
The K-value represents the horizontal distance in meters required to achieve a 1% change in grade:
          PVI (Station_v, Elev_v)
                 /\
     +g1 (%)   /  \   -g2 (%)
              /    \
   BVC ------*------*------ EVC
       |<-- L_v / 2 -->|<-- L_v / 2 -->|
       |<--------- L_v --------------->|
Step 3: Determine Stopping Sight Distance (SSD) Safety Envelope
Calculate the minimum Stopping Sight Distance (SSD) required for the corridor design speed:
Where driver perception-reaction time t = 2.5 seconds and comfortable deceleration rate a = 3.4 m/s²:
• 50 km/h: SSD = 65 m
• 80 km/h: SSD = 130 m
• 100 km/h: SSD = 185 m
• 120 km/h: SSD = 250 m.
Step 4: Audit Crest Curve K-Values Against Standards
For crest vertical curves, sight distance is limited by the curve crest blocking driver vision. The theoretical minimum K-value is:
For the long-curve case with a 1.08 m eye height and 0.60 m object height, the example SSDs of 65, 130 and 185 m give approximately 6.4, 25.7 and 52.0 m per percentage point. Compare against the design values in AASHTO Green Book, 7th edition (2018), Table 3-35, or your governing project standard.
Step 5: Audit Sag Curve K-Values for Headlight Sight Distance
On sag vertical curves, nighttime sight distance is limited by the headlight illumination beam spread (headlight height h3 = 0.60m, upward divergence angle beta = 1.0°):
Using the rounded stopping sight distances above, the long-curve equation (SSD ≤ curve length) gives these illustrative K-values in m per percentage point:
• 50 km/h: K_sag = 12.2 (SSD 65 m)
• 80 km/h: K_sag = 29.5 (SSD 130 m)
• 100 km/h: K_sag = 44.7 (SSD 185 m)
• 120 km/h: K_sag = 63.0 (SSD 250 m).
If the computed curve length is shorter than SSD, use the short-curve equation and check the governing project criteria. See Iowa DOT Design Manual §6D-1 for both cases.
Step 6: Run Automated Audit & Compile Quality Control Brief
Upload the PVI report into Infradigital's Vertical Alignment Formatter. The formatter organizes the imported PVI data and exports a workbook. Check design criteria and turning points independently before using the workbook for review.